Mainframe response-time monitoring
WND Terminal times every transaction for everyone using it, where they feel it, and tells operations what changed in one sentence.
Included in the Enterprise plan. See pricing
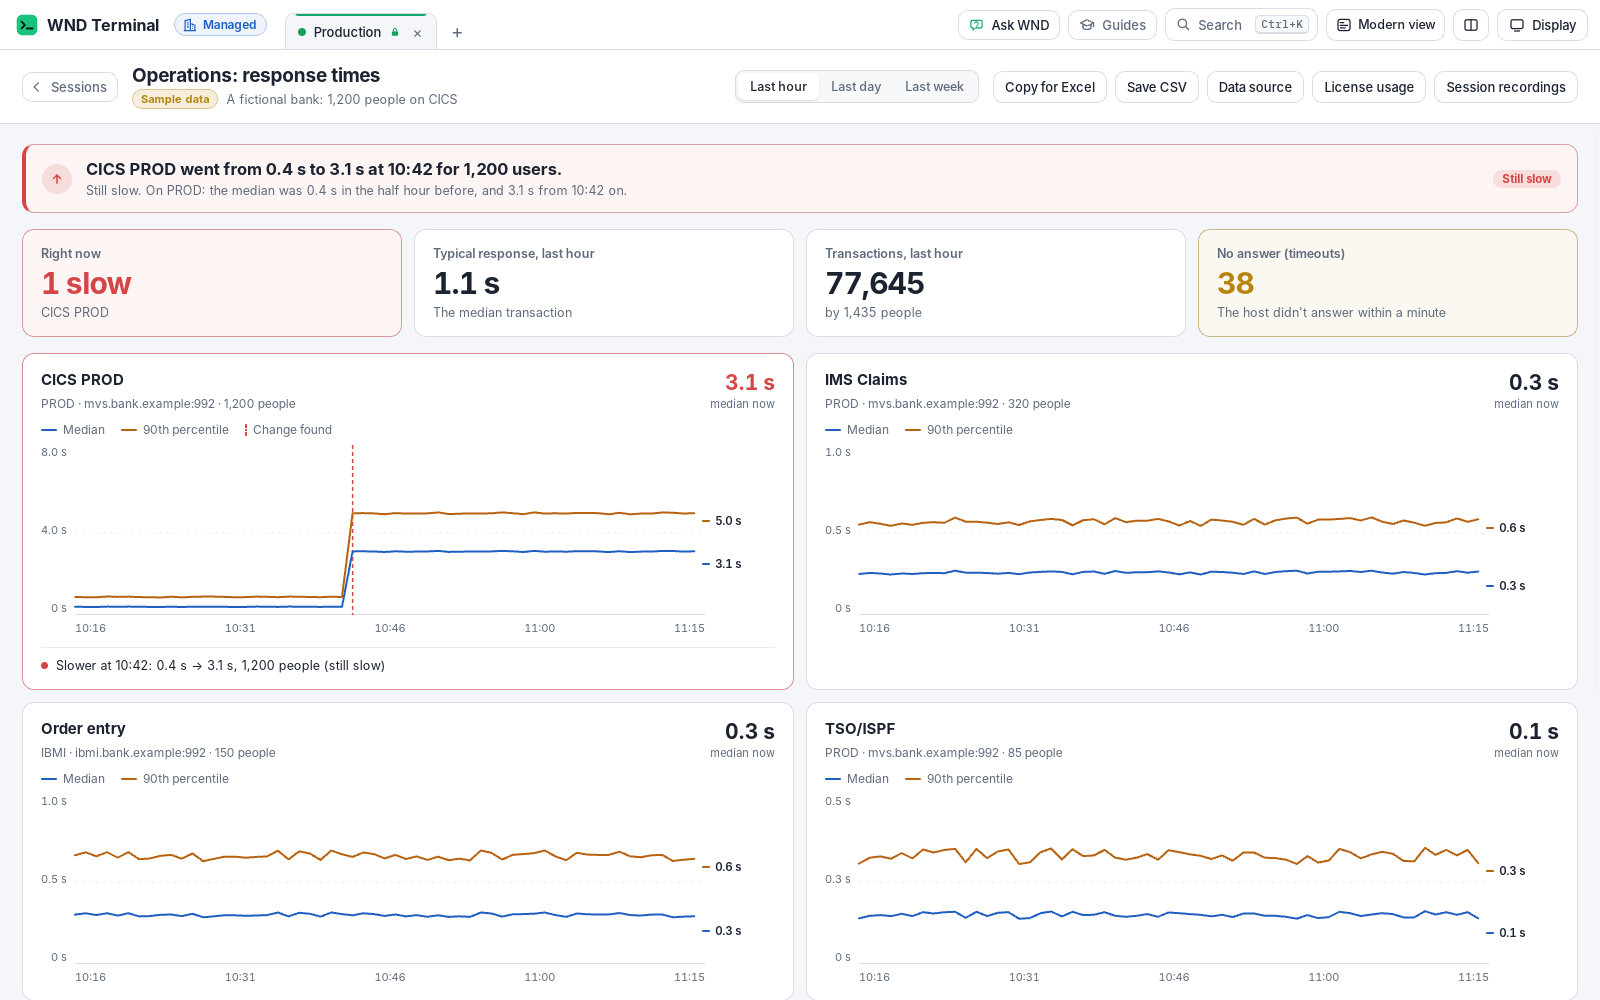
Response-time monitoring is a WND Terminal feature that measures how long the mainframe or IBM i takes to answer each Enter, PF, PA and Clear key, for every person using the app. It sums the timings each minute (count, median, 90th and 99th percentile, slowest, timeouts), sends no screen contents or typing, and delivers the summaries to a shared folder, Splunk and an Operations view that finds slowdowns by itself.
The problem
Users say “the mainframe is slow.” Our host monitoring says everything’s green. We have no numbers from the user’s side.
By the time the ticket reaches us, the slowdown is over, and we can’t tell which screen, which region or how many people it hit.
How it works
IT turns it on
With the policy (RecordResponseTimes, off until set), naming a shared folder (ResponseTimeFolder) and, if you like, a Splunk HTTP Event Collector.
Every transaction is timed
From the moment a key goes to the host until the host’s answer gives the keyboard back, plus the time to the host’s first record. The person’s own time never counts.
Each minute, WND Terminal sums it up
Per connection, transaction label and screen, and copies the summary to the folder and Splunk, on a thread of its own so typing never waits.
The Operations view says what changed
In one sentence, such as: “CICS PROD went from 0.4 s to 3.1 s at 10:42 for 1,200 users.” (An example from the app’s built-in sample data, a fictional bank.)
What it does
Measured where people feel it
On a mainframe, from the key to the write that restores the keyboard; on IBM i, to the end of the input-inhibited state, or an error. A key with no answer within a minute is a timeout.
CICS, IMS, TSO and IBM i
Over TN3270, TN3270E and TN5250. Keys from macros and Fill from Excel are timed too; file transfers aren’t.
Transaction labels you define
Rules such as "CICS PROD": "connection = PROD AND title starts 'CICS'" run on the computer; only the label is sent.
Screen signatures, not screen text
Each screen is identified by a short hash of where its fields are, the same on every computer, so you can tell which screen was slow without seeing what was on it.
Per-minute records
Count, median, 90th and 99th percentile, slowest, time to first record and timeouts, as JSON lines in the folder and as Splunk events (sourcetype wnd:response).
Operations view
Median and 90th percentile per connection and label over the last hour, day or week, people affected, the slowest screens, and changes found automatically. Copy for Excel and Save CSV.
Change detection that ignores noise
A minute at least twice as slow as the median of the half hour before, at least half a second different, confirmed by the next five minutes, with enough people affected.
Resilient delivery
While Splunk can’t be reached, records wait in a queue on disk (up to 5,000) and are retried. A laptop away from the network catches up when it’s back.
Under IT’s control
Every capability in WND Terminal follows the same rules: IT decides, the audit log records it, and nothing is sent to WND Software.
Operations data on the security page →- Never screen contents or typing. Each transaction is known only by connection, host and port, terminal or device name, screen signature and, when IT defines one, a label.
- The login is optional. It’s included only when IT turns on
ResponseTimeIncludeUser; otherwise only the computer’s name (and department, if set). - Off until IT turns it on.
RecordResponseTimesis off by default. People can still see their own last response time in the status line. - Inside your network. Summaries go to your folder and your Splunk. Nothing is sent to WND Software.
Operations is where emulator choice shows up

Union Pacific configured backup hosts in WND Terminal. In the first quarterly disaster-recovery test after rollout, sessions moved to the backup host by themselves, against more than 200 calls in the previous test.
Read the Union Pacific story →The trains don’t care what terminal emulator we use. But they care a lot when the mainframe goes away for 45 minutes.
Greg Halvorsen, Director, Operations Technology, Union Pacific
Tested end to end
WND tests this in the real app with CICS at its usual speed and then slowed down, checking the summaries in the shared folder and in a stand-in Splunk collector, and that the Operations view says what changed.
Response-time monitoring: questions
What exactly is measured?
The time from a key (Enter, PF, PA, Clear, or an IBM i AID key) going to the host until the host’s answer gives the keyboard back, plus the time to the host’s first record. The person’s own time never counts.
Does it send screen contents?
No. Transactions are identified by connection, host, terminal name, a screen signature (a hash of the field layout, never the text) and an optional label.
Does it work with Splunk?
Yes. Per-minute summaries go to a Splunk HTTP Event Collector with sourcetype wnd:response, queued on disk and retried while Splunk is unreachable. They also go to a shared folder as JSON lines.
Does it slow down the session?
No. Summaries are written and sent on a separate thread, so typing never waits.
Is it on by default?
No. IT turns it on with RecordResponseTimes in the policy. Individuals can show their own last response time in the status line without any policy.
Does it cover IBM i?
Yes. IBM i transactions are timed to the end of the input-inhibited state, and transaction labels can match IBM i connections and screen titles.
Works well with
See your own transactions, timed.
Turn it on for a pilot group during a proof of value and watch the Operations view fill in.